
There is good news amidst the persistently high incidence of COVID-19 in Georgia: the effective reproduction number, ‘R’ had already dropped to 1.03 (+-0.02) by the day before new lockdown measures were introduced. This bodes well for the effectiveness of the current interventions.
R is a key metric to monitor the spread of any epidemic. It measures the number of people one infected person passes the virus on to, on average. If R is larger than 1, the number of infections increases; if R is lower than 1, they decrease.
The estimates at hand are based on state-of-the-art algorithms developed at Imperial College London and ETH Zürich and on regional case numbers published by the National Centre for Disease Control. To my knowledge, the figures presented here are the first public estimates of the effective reproduction number on a regional level for Georgia.
According to these estimates, in the second half of November, the average COVID-19 infected person in Georgia transmitted the virus to 1.03 people. Regional estimates vary between 0.88 (+-0.05) in Adjara and 1.23 (+-0.09) in Shida Kartli, with the capital Tbilisi right at 1.00 (+-0.03). This is significantly down from around 1.3 nationally, and from over 1.5 in many regions, in the first half of October.
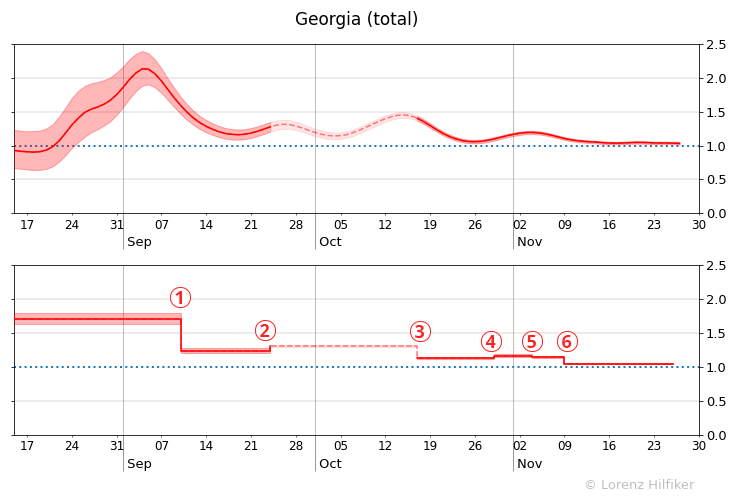
The estimates of the effective reproduction number R are shown here with a 95% confidence band. A wide confidence band indicates high uncertainty, which can be due to low case numbers. Since cases are typically confirmed 1–2 weeks after infection, the latest estimates of R reflect the epidemiological situation around the end of November.
Estimates between 24 September and 17 October (the dashed line segment) are unreliable due to a change in testing strategy. Estimates for late September and early October significantly underestimate the true value, while estimates towards the middle of October are slightly above the true value.
For COVID-19 in the absence of any interventions or behavioural changes, R was estimated to be around 2.5–3 in most countries. This roughly translates to cases doubling every 3–4 days. In contrast, the reduction to R=1.03 implies an expected doubling time of 1–2 months.
So did the government interventions work?
The lower half of the figures show the average reproduction number between major events or government interventions.
Evidently, the average R dropped considerably in all regions following the night-time curfews introduced on 9 November. This is true even for regions to which the curfew did not apply.
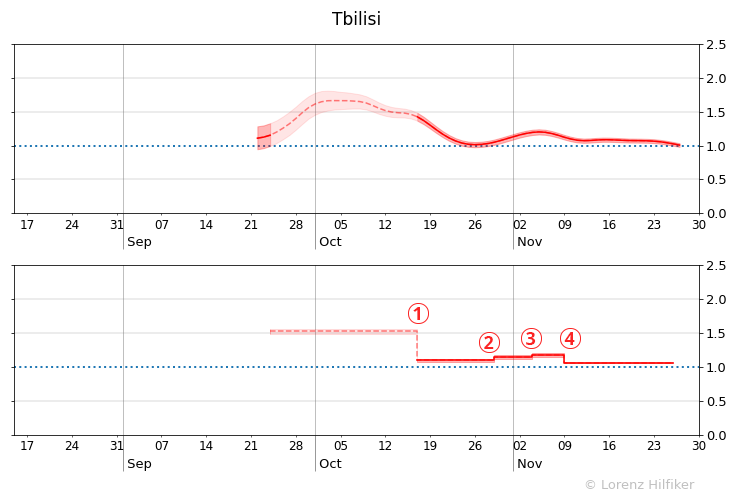
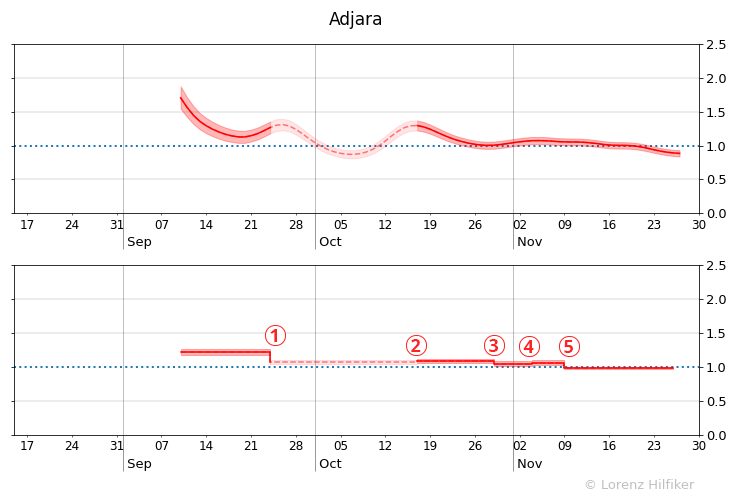
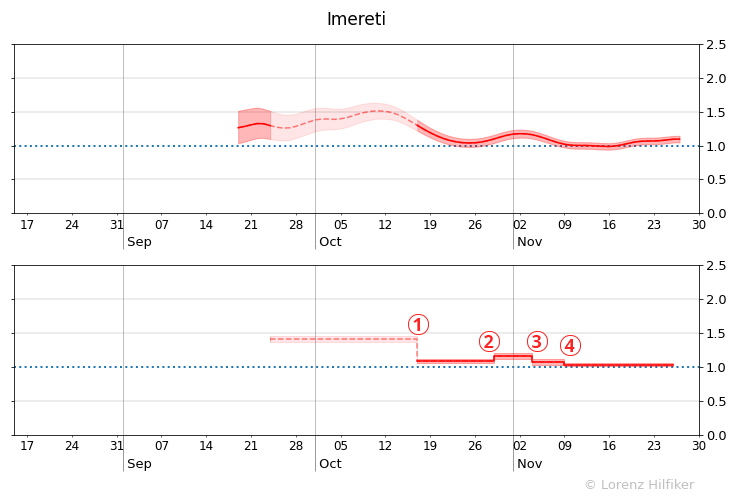
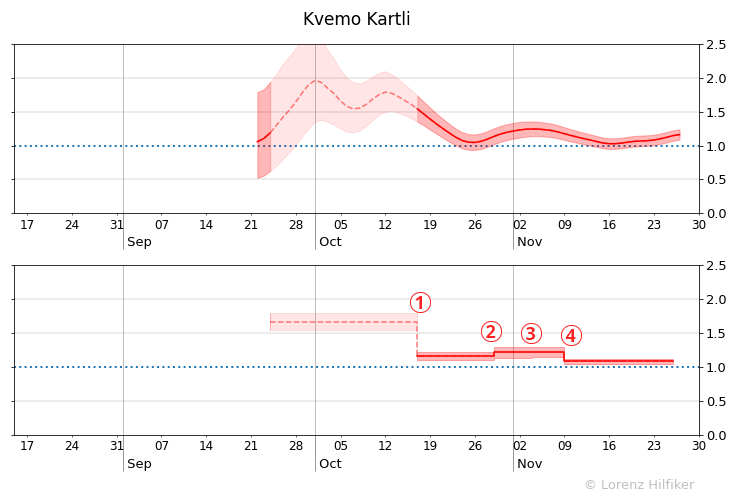
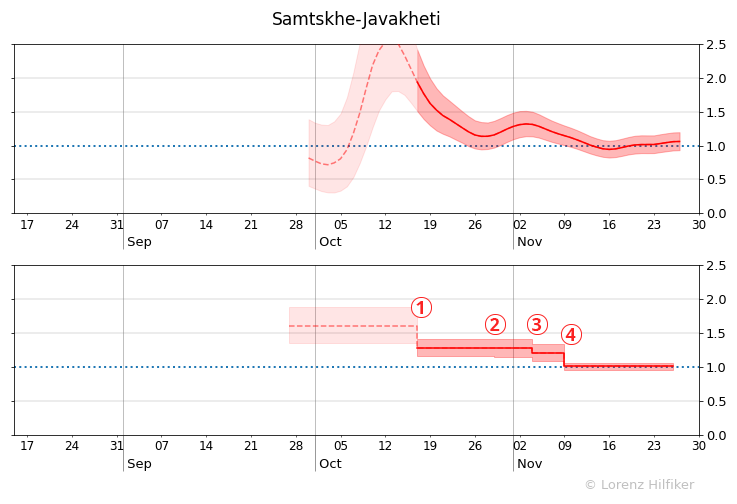
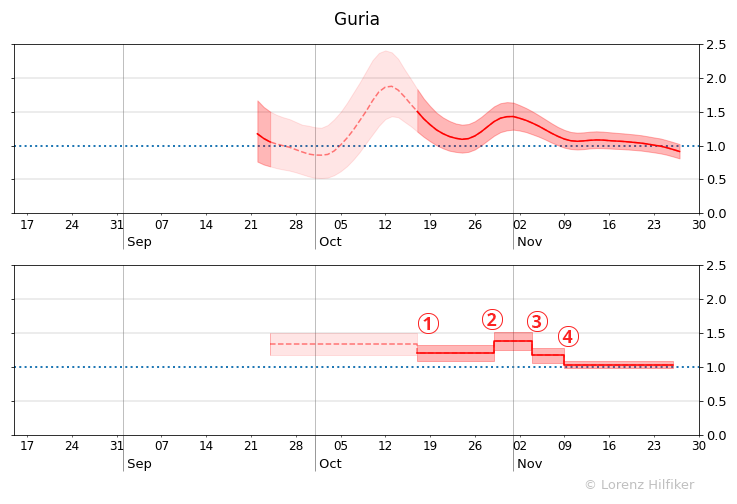
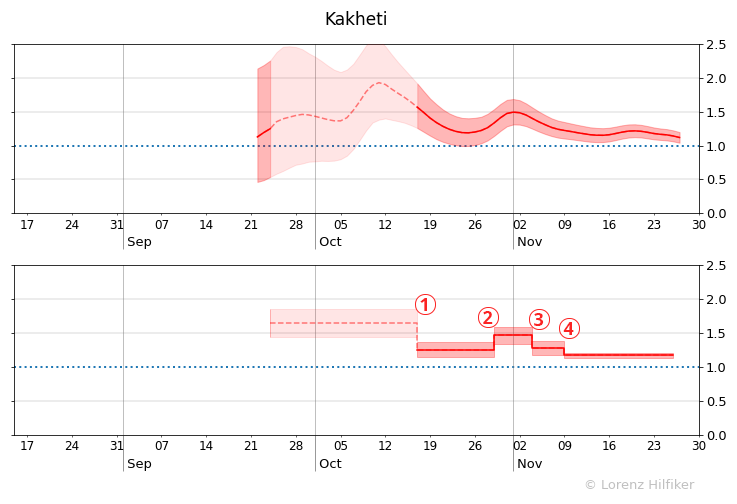
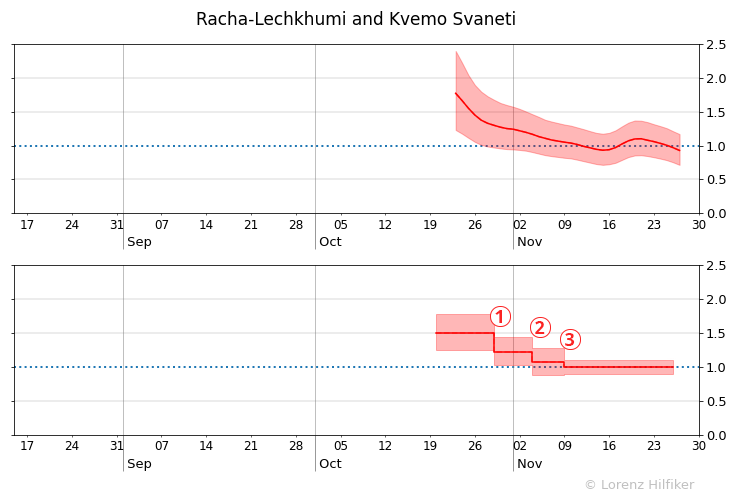
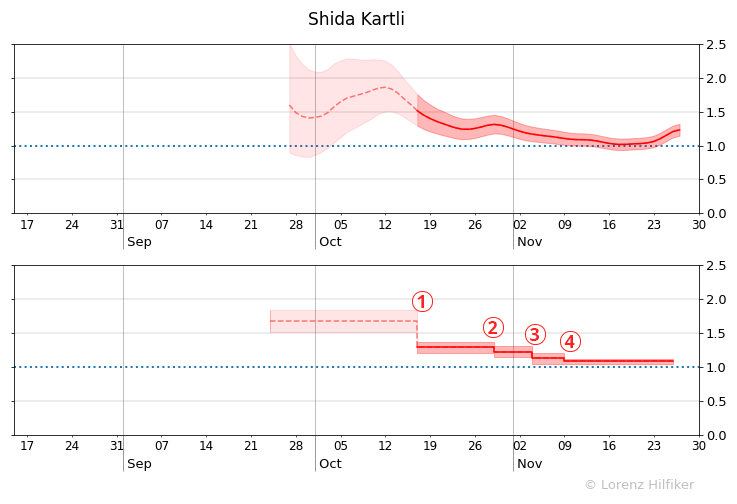
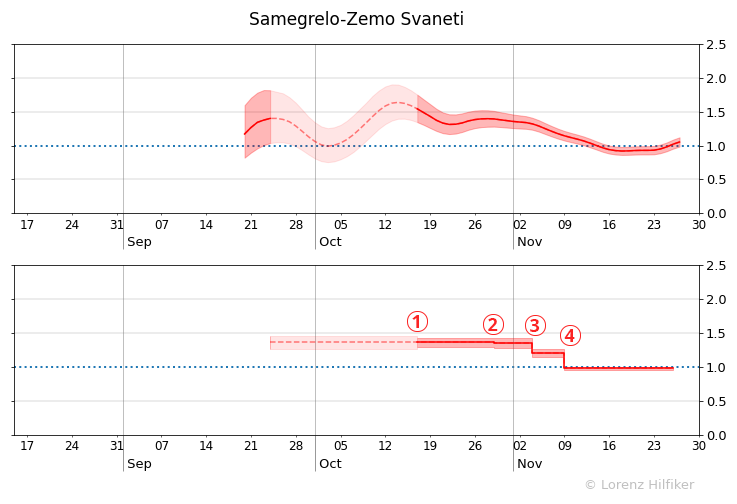
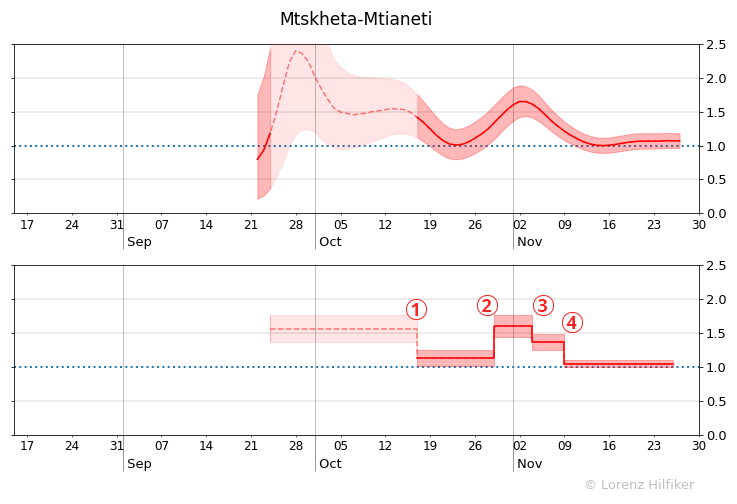
Moreover, almost all regions experienced a significant decrease of R in the middle of October. This came in the wake of government interventions in Tbilisi, Imereti (16 October) and Mtskheta (20 October), namely restricted opening hours for restaurants, bars and other entertainment facilities. Again, a slowdown of the spreading is observed even in regions to which the measures did not apply.
This could suggest that factors such as the signalling effect of the interventions and more urgent appeals by the authorities had as much of an impact on public behaviour as the actual measures themselves.
The national parliamentary elections on 31 October seem to have been associated with a temporary increase of R in many regions. This is a particularly sensitive point given that the government has repeatedly accused opposition protesters of fueling transmission of the virus. Transmission indeed seems to have risen in Tbilisi in the aftermath of the elections, but even more so in many rural regions during the election weekend.
The figures also show a rise of R at the beginning of October in Tbilisi, Imereti, and Kvemo Kartli. This is puzzling given that estimates around that time are expected to have a downward bias due to the change in testing policy on 3 October, with asymptomatic contacts of confirmed cases now only being tested if or when they show symptoms.
One plausible explanation is that the reopening of primary schools on 1 October in Tbilisi, Kutaisi, and Rustavi led to increased transmission.
What can be expected from the lockdown?
The government introduced a number of sweeping new measures on 28 November for the next two months, including the closure of schools, restaurants, bars, gyms, and non-essential shops and markets.
Their effect has only started to be captured in the estimates presented here, but the figures above bode well for the epidemiological development in the coming weeks: if the lockdown measures have any impact at all, they are set to push R below 1, leading to a substantial reduction in caseload from mid-December onwards.
Given the economic cost of a prolonged lockdown, the crucial question is not so much if, but how fast the reduction will take place.
This depends on the actual amount by which R is reduced. As a rule of thumb, at R=0.9, cases will be cut in half within a month, at R=0.8 within two weeks, and at R=0.6 within one week.
The seemingly small difference is in fact a matter of life and death, as a simple projection shows that if R remains very close to 1 during the lockdown, total deaths could rise to 5,000 by February — and continue to pile up in spring if the strict measures are not upheld.
Yet in the highly optimistic scenario of a constant R=0.6 over the next two months, the country might just about limit its total coronavirus death toll to 2,500 until the beginning of March.
Crucially, infections by that point would be so low again that the first batch of vaccines announced for spring could come in time to prevent much further carnage, even if the lockdown is not prolonged and R ticks up again. Rarely has it mattered so much how we collectively conduct our lives over the next two months.
A version of this article was first published on 3 December on the COVID in Georgia blog, where you can find more on the methodology used.


