Both Georgia and Armenia are known for being close-knit, but levels of social ties and trust vary both between the countries and between demographics. And while levels of trust have increased in Armenia in the last decade, in Georgia, the opposite is true.
Past research has suggested that both Georgia and Armenia have high levels of bonding social capital — levels of trust within a family and community — but low levels of bridging social capital — the ability to make bonds with people outside one’s immediate circle.
However, recent data from the Caucasus Barometer shows that while in Armenia some measures of bonding social capital have risen significantly in the decade between 2011 and 2021, the same characteristics have remained largely stagnant in Georgia.
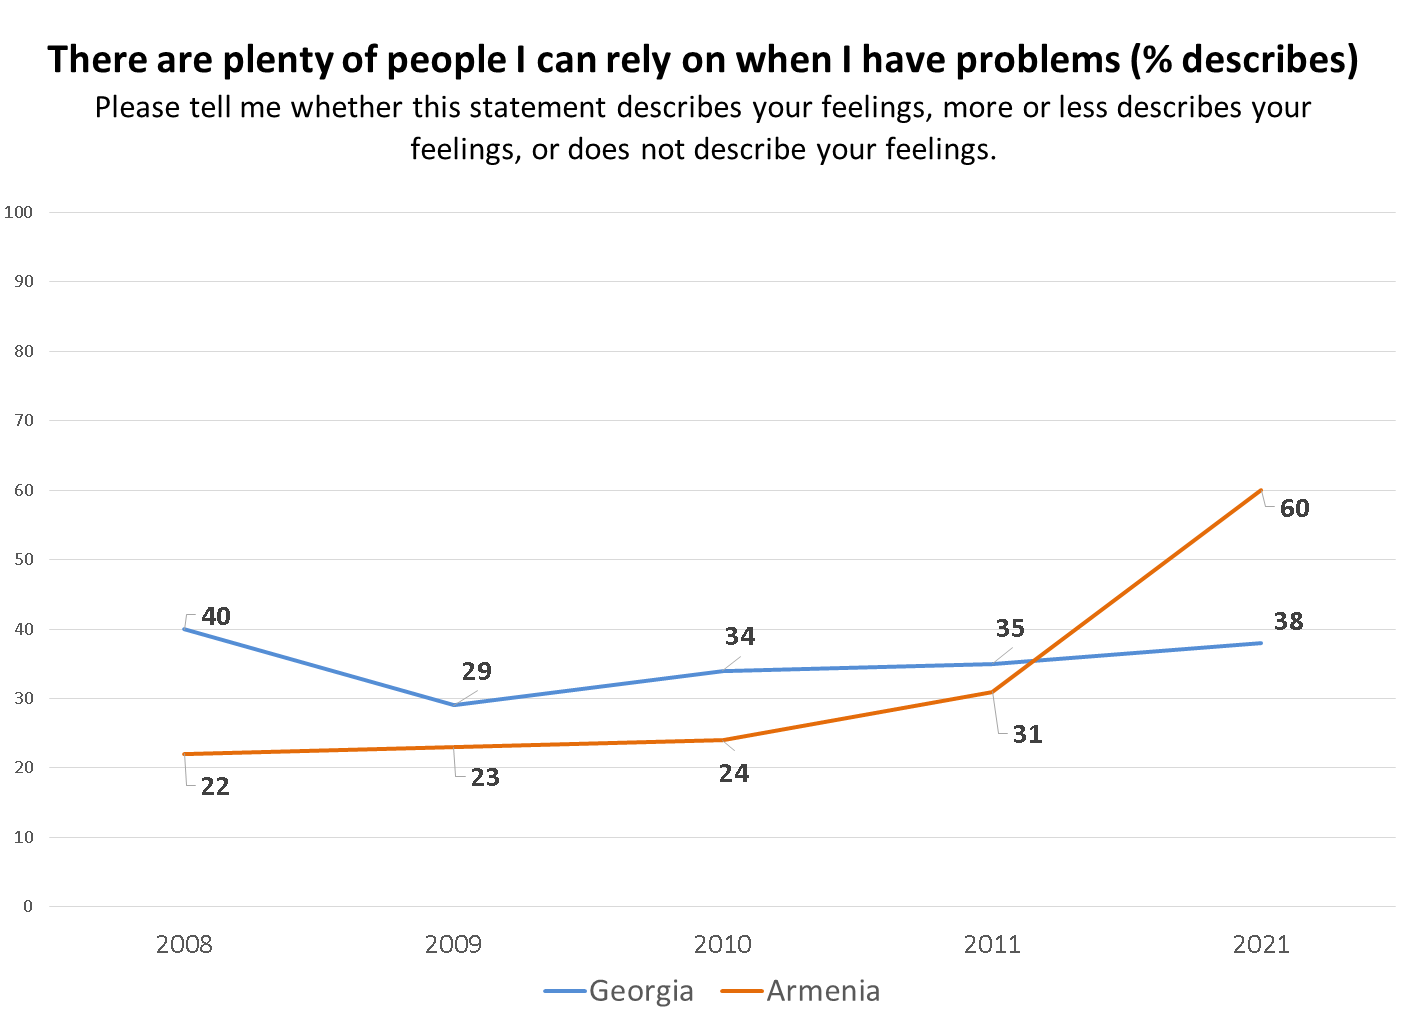
One measure of social capital is whether people feel that they have people that they can rely on when they have problems.
The share of the Georgian population who say that they have people they can rely on has varied slightly over the years, but remained between 34% and 40% between 2008 and 2021. The exception was a low of 29% in 2009, a year which is a relative outlier for Georgia.
In Armenia, however, respondents have increasingly felt that there are people that they can rely on, with this share doubling from 31% in 2011 to 60% in 2021.

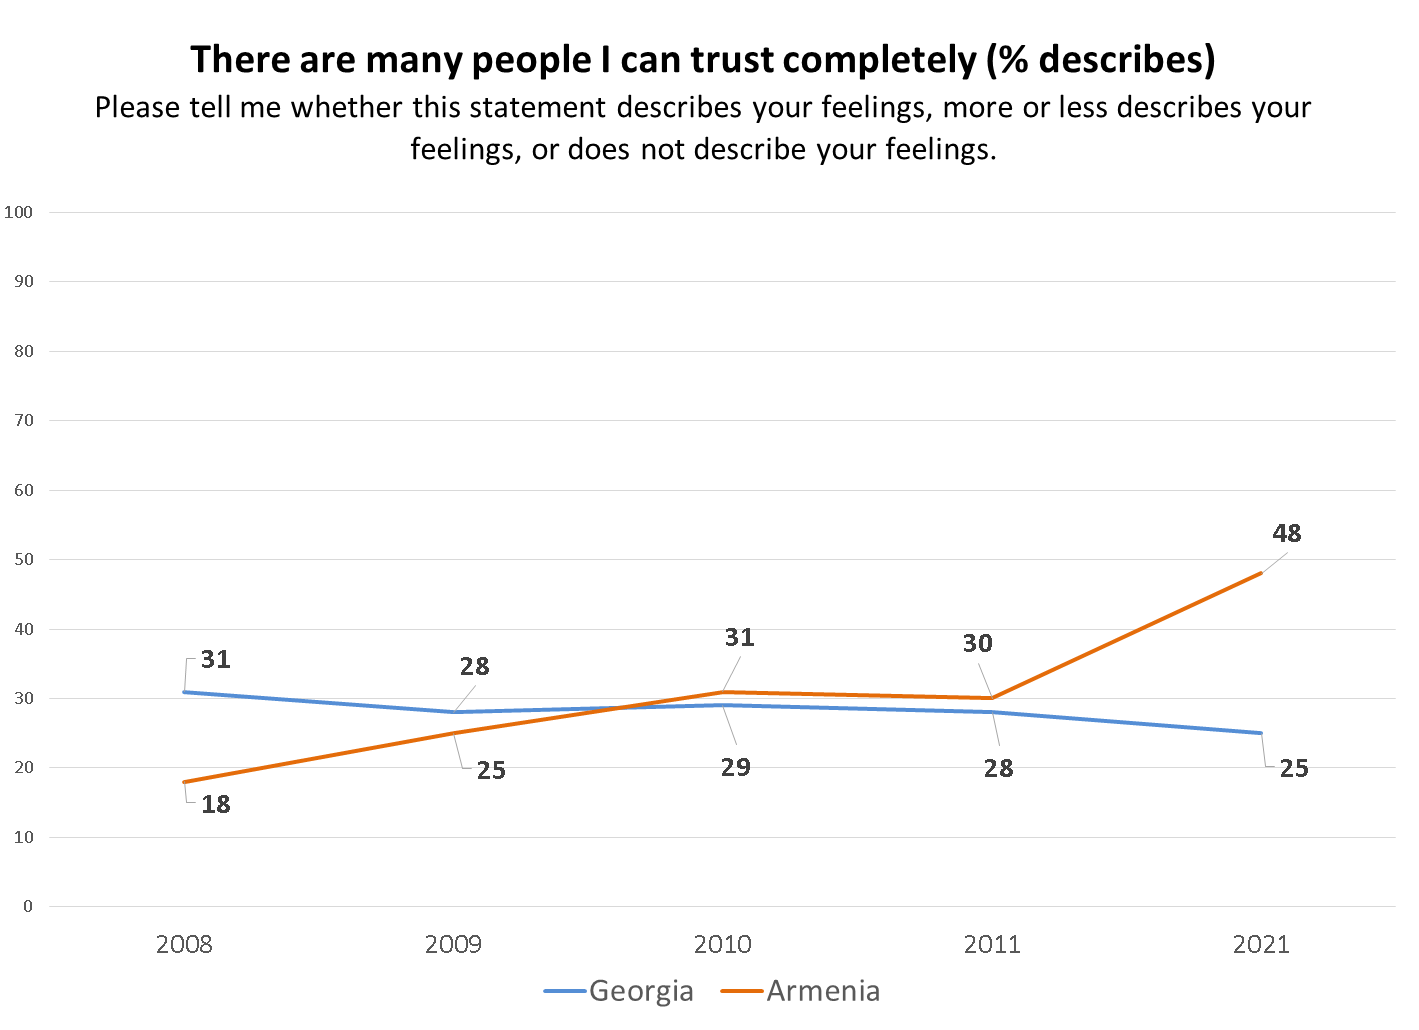
The data show a similar pattern with regard to the statement, ‘There are many people I can trust completely’.
In 2008, 31% of the Georgian public reported that this described them, compared to 18% in Armenia. Since then, however, the situation has reversed, with 25% of the public in Georgia reporting this in 2021, compared with 48% in Armenia.

The relative levels of social capital which people report is associated with a number of demographic characteristics in Georgia and Armenia.
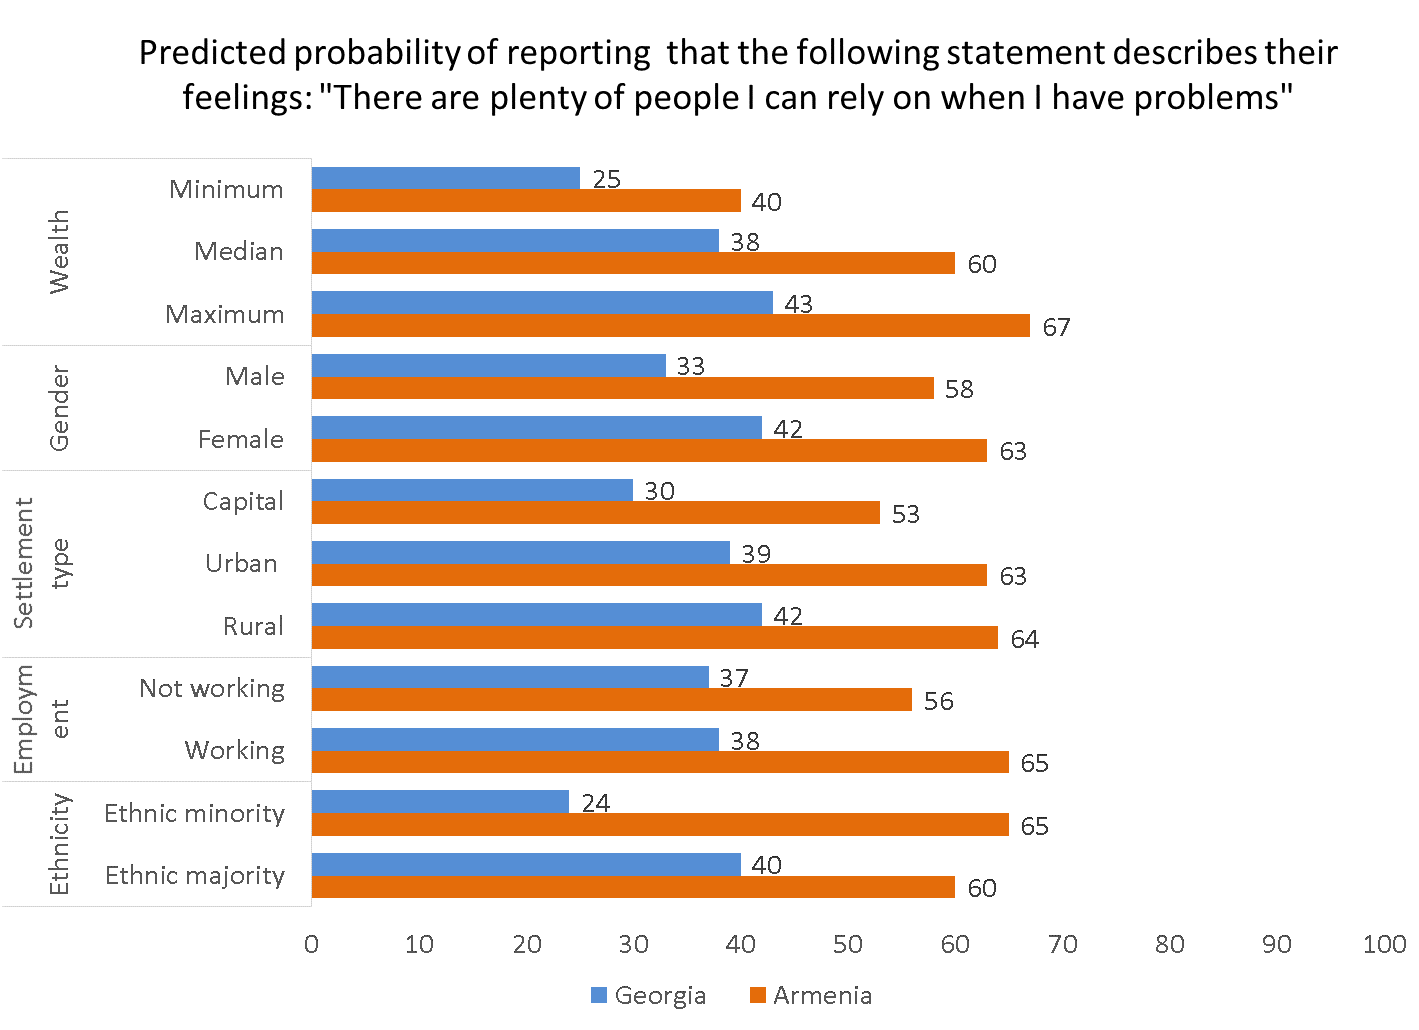
A regression model shows that in both Georgia and Armenia, people outside of the capital cities are more likely to say that in times of trouble, they have many individuals they can turn to than those living in Tbilisi and Yerevan. Similarly, wealthier people are more likely to believe they have people to rely on in both countries.
In Georgia, women are more likely to report they have plenty of people to turn to when faced with problems. In Armenia, gender is not associated with responses to this question.
In Georgia, ethnic Georgians were more likely to agree compared to ethnic minorities. Due to the small number of people of ethnic minority descent in Armenia, only a small number were present in the sample. Consequently, the same association was not tested in Armenia.
Employed people in Armenia, but not Georgia, are more likely to feel there are people they can rely on. Age and education are not associated with responses to this question in either country, controlling for other factors.
Regarding how much people feel they can trust others, in Georgia, this is associated with both where someone lives and their sex.
Men are more likely to say that there are many people they can trust completely compared to women, while people who live in Tbilisi are less likely to report people can be trusted, compared with people in other urban and rural areas. There were no differences associated with age, education, employment, or ethnicity on this question.
In Armenia, wealth is a significant predictor of trusting others. Wealthier respondents were more likely to indicate that there were many people they could trust completely. In Armenia, no other variable was associated with this statement.

Over the last decade, the dynamics of social capital in Armenia have undergone a transformation, while in Georgia they have remained stagnant. While Georgian people had more social capital in the past, today Armenians are more likely to have stronger bonding social capital.
Note: The results presented in the above chart came from regression model of the CB 2021 wave. The regressions included the following variables: sex (male or female), age group (18–34, 35–54, 55+), settlement type (capital, urban, rural), ethnic group (ethnic majority or ethnic minority), educational attainment (secondary or lower, secondary technical, higher than secondary), employment (working, not working), wealth (ownership of 14 different durable goods, a common proxy for wealth).
The views expressed in this article reflect the views of the author alone, and do not necessarily reflect the views of CRRC Georgia, or any related entity.


