Survey data from the last decade shows that more and more Georgians own household goods like mobile phones, TVs and washing machines, but inequalities in such material wealth still remain.
The Caucasus Barometer survey shows a steady growth in ownership of durable goods across Georgia over the last eight years.
The percentage of survey respondents reporting ownership of each of a basket of seven household items has risen since 2011, with the increase most marked in rural areas. Whilst the rural-urban divide is seen to be closing, large gaps remain between respondents with higher education and those without.
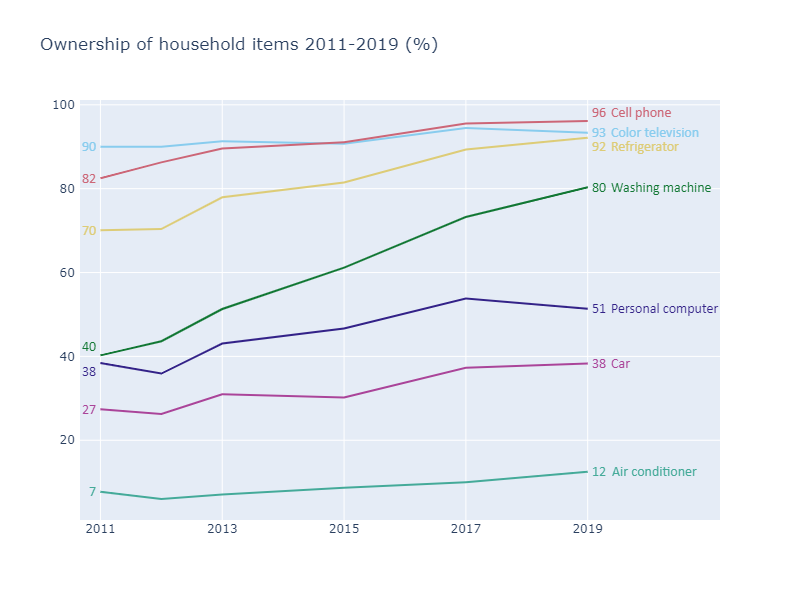
Virtually all households now possess a mobile phone (96% of households), colour television (93%), and a refrigerator (92%). Colour television ownership has been consistently high and has grown slightly in the last eight years. The same period has also seen large increases in ownership of refrigerators (up 22 percentage points) and cell phones (up 14 percentage points).
The largest increase, however, is seen in washing machine ownership. In 2011, washing machines could be considered a luxury item, with a minority of households (40%) owning one. In 2019, washing machine ownership is now the norm, with ownership doubling to 80% of households.
Just over half of households now possess a personal computer. This figure fell slightly between 2017 and 2019, potentially resulting from growth in mobile phone use and increased mobile internet connectivity.
Car ownership is also up by over ten percentage points, and the number of households owning an air conditioning unit has increased by five percentage points to 12%.

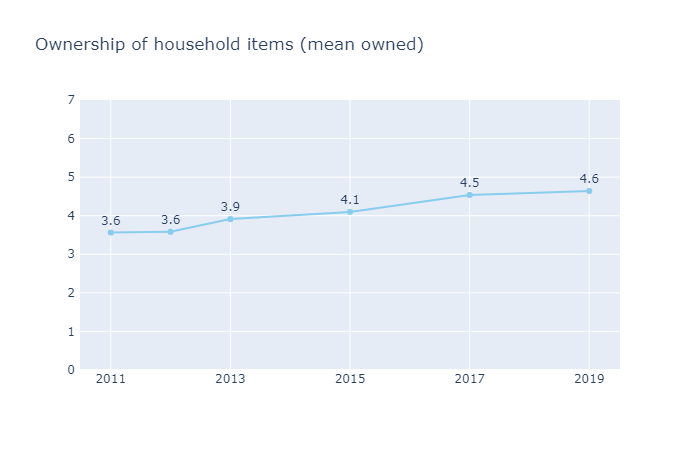
The average number of items owned by a Georgian household from within this basket of seven goods has grown steadily since 2011. In 2011, a typical household possessed 3.6 items from the basket. This has increased to an average of 4.6 items in 2019.

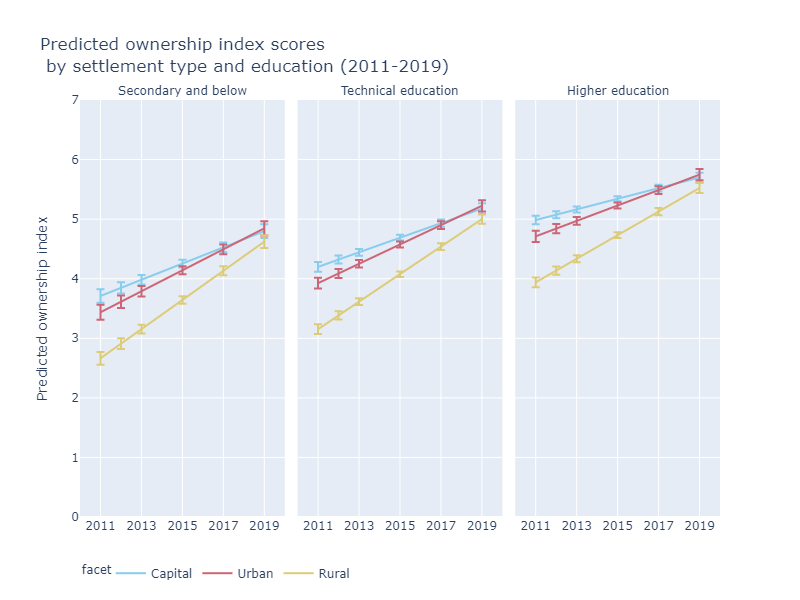
Growth has been most dramatic in rural areas, which have caught up rapidly with the capital and other urban settlements. In 2011, a respondent in a rural area with a secondary or technical education could be expected to have 3.2 of the items on the eight-point index compared to 4.2 for a resident of Tbilisi: a gap of one point on the basket. Today, rural households have for the most part caught up with their urban and capital counterparts, scoring just 0.2 points lower on average holding all else equal.
Nonetheless, education remains a key predictor of household asset ownership with the analysis highlighting a continued sharp divide between respondents with higher levels of education and those without.
Holding all else equal, those with a higher education have on average 15% (or 0.67) more basic household goods than those with a technical education, and 28% (or 1.1) more than those with an incomplete secondary education and below.

Asset ownership is a simple proxy for household wealth and fails to account for other financial characteristics of a household, such as income or debt. But, the measure does enable analysis of the extent to which some basic material requirements are being met.
The overall trend in the last eight years has been positive: washing machines and refrigerators are now found in the majority of Georgian homes and at a household level, mobile phone coverage is nearly complete.
When contrasting the capital and other areas of Georgia, we see that rural areas in particular have caught up rapidly with Tbilisi. But despite greater equality across settlement types, those with higher levels of education appear to enjoy a substantially more comfortable home life than those without.
Note: The above analysis is based on an ordinary least squares (OLS) regression.
The dependent variable is a simple additive index of positive responses to questions regarding ownership of the following seven items: cell phone, color television, refrigerator, washing machine, personal computer, car, air conditioner. A score of zero on the index represents ownership of none of these items, a score of seven corresponds to ownership of all items.
The independent variables in the regression are the respondent’s sex, age, ethnic minority status, settlement type, and education level. Independent variables were interacted with the number of years since the first wave in the dataset, where zero corresponds to 2011 and eight to 2019.
Differences between rural and capital scores on the index in 2019 were statistically significant at p <= 0.05 on a univariate OLS regression.


