On 8 November, the European Commission is set to offer its recommendation on whether the EU should grant Georgia candidate status. A CRRC Georgia survey found that only a third of Georgian-speaking adults expected that Georgia would receive EU candidate status by the end of the year.
The survey, run from 4-8 October 2023, also found a strong partisan divide. Despite having less favourable perceptions of the EU, supporters of the ruling Georgian Dream party are significantly more likely to think Georgia will be granted candidate status than opposition supporters and people that do not support any party.
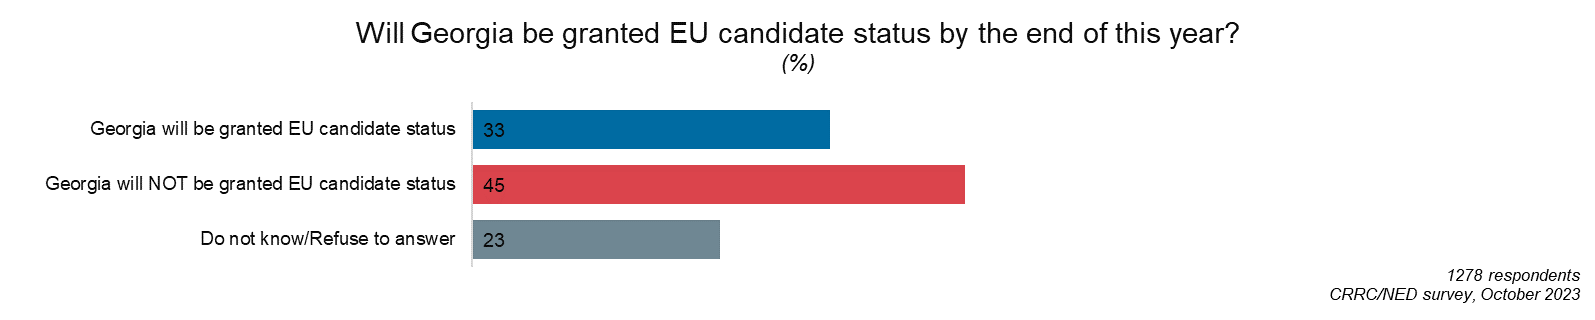
The public was asked if they expected that Georgia would be granted EU candidate status by the end of 2023. A plurality of the public (45%) believe that Georgia will not be granted EU candidate status, a third of the public (33%) believe that Georgia will receive the status, and the remaining 22% are unsure.
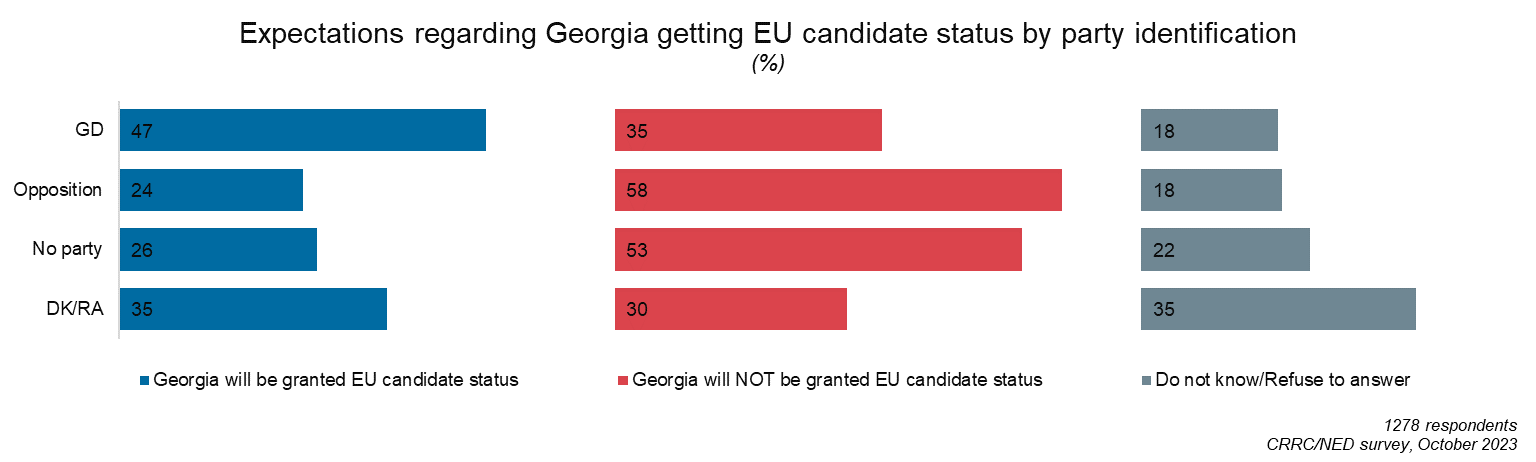
Expectations vary substantially based on which party someone supports. Just under half of Georgian Dream supporters (47%) believe that EU candidate status will be granted, compared with one in four opposition supporters (24%). Roughly one in three ruling party supporters (35%) believe Georgia will not receive a positive decision from the EU. In contrast, a majority of opposition supporters (58%) report the same. Those that say no party is closest to them report similar attitudes to opposition supporters.
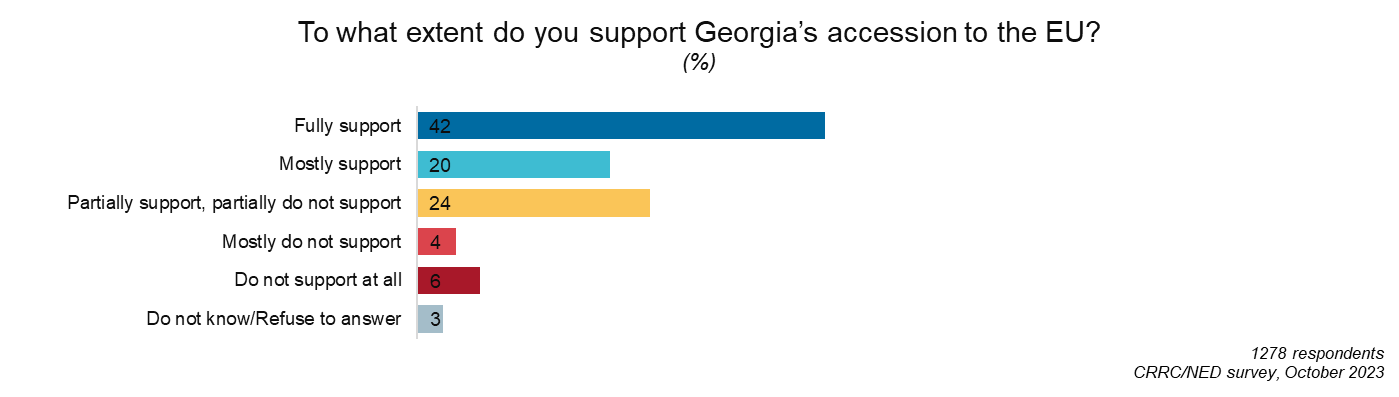
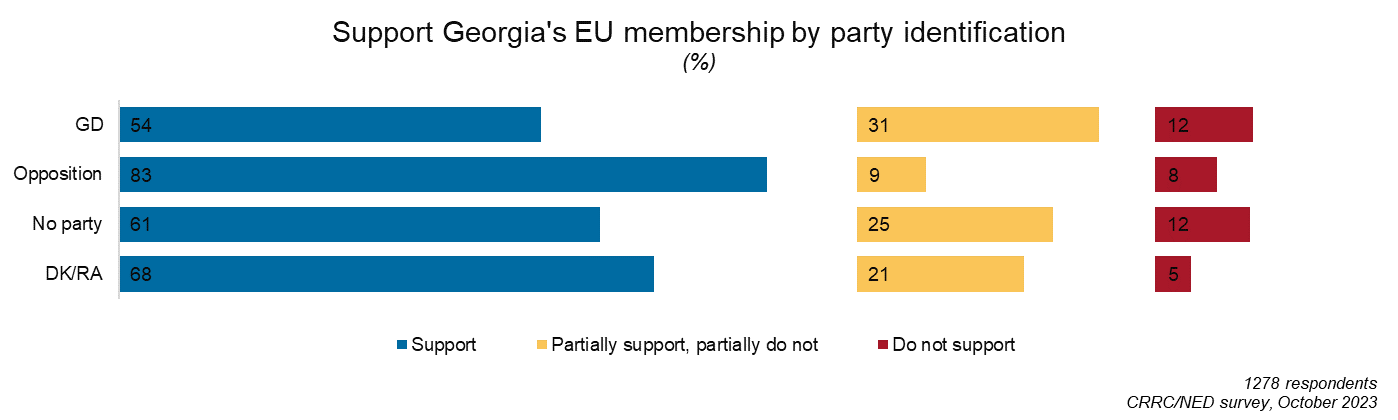
These answers are situated in a context of most Georgians supporting the country’s potential membership in the EU. Approximately two thirds (62%) of the Georgian-speaking population support membership fully or mostly, and a further quarter (24%) support it partially. Only 10% do not support the country’s membership in the EU. The remaining 3% of respondents are unsure or preferred not to respond.
Support for the country’s membership also varies substantially with partisanship. Slightly more than half (54%) of Georgian Dream supporters support Georgia’s EU membership, around a third (31%) partially support it, and 12% do not support it. By comparison, eight in ten opposition voters (83%) support Georgia’s EU membership, one in ten (9%) only partially support it, and 8% oppose it. Six out of ten non-partisan voters (61%) support Georgia’s EU membership, a quarter (25%) partially support it, and 12% do not support it at all. Notably, those who support no party have more similar views to those who support the ruling party than those in the opposition on this issue.
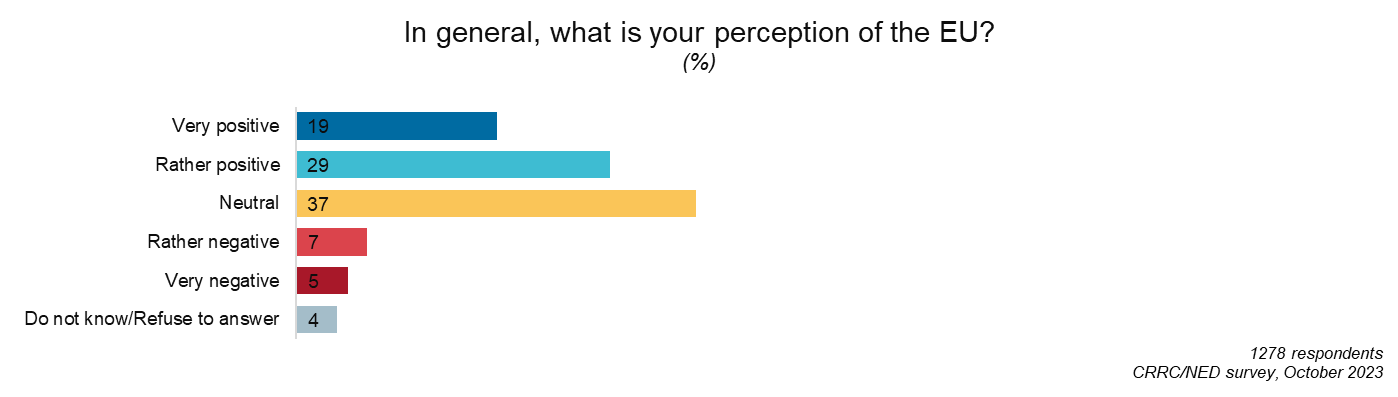
Overall, half of the population (48%) has a positive attitude toward the EU. Only one in ten Georgians (12%) has a negative perception of the EU. Slightly more than a third of the public (37%) has a neutral perception of the EU. The remaining 4% of the public are unsure or preferred not to respond.
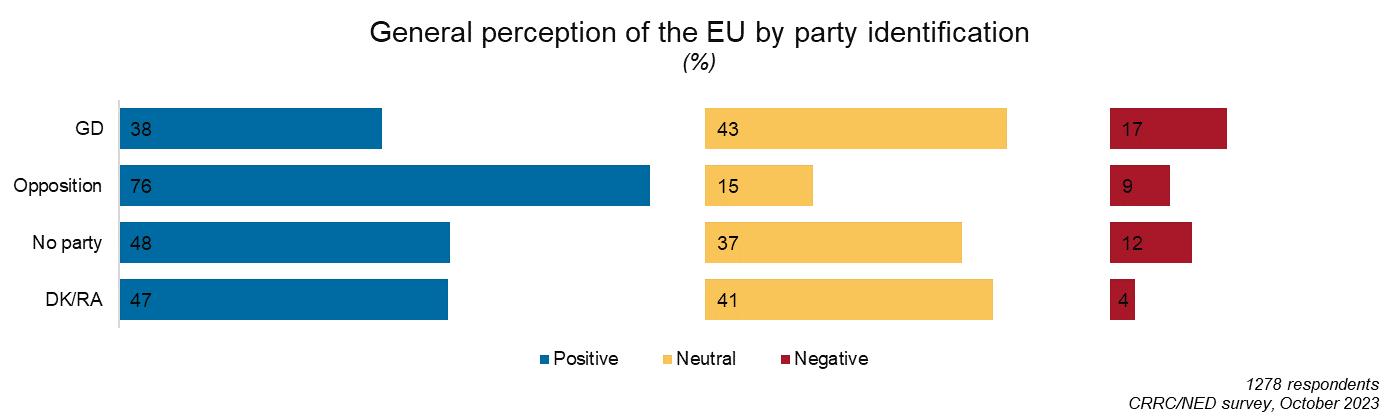
Georgian Dream supporters and opposition supporters differ substantially in terms of their general perceptions of the EU. Slightly more than a third of Georgian Dream supporters (38%) have positive perceptions of the EU, while 43% report neutral attitudes. A further 17% report negative attitudes towards the EU. In contrast, three in four opposition supporters (76%) have positive views of the EU, 15% have a neutral view, and only one in eleven (9%) report a negative attitude. As for people who do not feel close to any political party, half (48%) have a positive view of the EU, 37% a neutral view, and 12% a negative attitude.
Only a third of Georgians believe that the country will gain candidate status. While ruling party supporters are substantially more likely to believe that the country will become a candidate, they are simultaneously far less positive about the EU than supporters of the opposition.
Note: The above differences across political groups were tested using logistic and ordinal regression models. The models controlled for the following variables: age group (18-35, 35-55, 55+), sex (male or female), education (completed secondary/lower, vocational or incomplete higher education/higher), settlement type (capital, urban, rural), party identification (Georgian Dream, Opposition, no party, DK/RA), employment (not working, working in the private sector, working in the public sector), social conservatism (low, mid-low, mid-high, high), and religious attendance (regularly, only on special occasions, rarely or never).
This article was written by Givi Silagadze, a researcher at CRRC-Georgia, and Koba Turmanidze, CRRC Georgia’s president. The article is based on data collected with the financial support of the National Endowment for Democracy (NED). The views expressed in this article are the authors’ alone and do not represent the views of NED, CRRC Georgia, or any related entity.